Roscan Announces Interim Resource of 1.02 Moz at 1.2 g/t Indicated, 0.20 Moz at 1.2g/t Inferred at its Kandiolé Project in Mali
Robust Starter Pit Potential of 377,000 ounces at 2.6 g/t at Mankouke South
Toronto, Ontario. – June 8, 2022 – Roscan Gold Corporation (“Roscan” or the “Company”) (TSX-V: ROS; FSE:2OJ; OTCQB:RCGCF) is pleased to announce its initial, pit-constrained, interim NI 43-101 compliant Mineral Resources reported at a gold price of only 1,500 USD per oz, of 27.4 million tonnes grading 1.2 g/t Au totaling 1.02 million ounces of gold in the Indicated Category and 5.2 million tonnes grading 1.2 g/t Au totaling 198,000 ounces of gold in the Inferred category at its Kandiole project in Mali.
Roscan’s maiden pit constrained Mineral Resource includes gold mineralization from six mineral deposits: Mankouke South, Mankouke Central, Kandiole1, Kandiole 2 and 4, Kabaya and Moussala. The discovery areas of Disse, Walia and Mankouke West were not included in the maiden resource due to lack of sufficient drilling to date but will be areas of upside for future exploration.
The cutoff date for data used in the resource estimate was March 25th 2022. Since March 25th, Roscan has continued its drilling campaign to infill and extend the saprolite resource area and to follow up on the deeper mineralization at the Mankouke South and Kandiole targets. Drilling results have encountered plunging zones of mineralization that remain open, which are currently being drilled and assayed.
Key Highlights:
- Robust initial Mineral Resource reported at a 0.3 g/t Au (oxide) and 0.42 (fresh) cut-off grade and $1500 per ounce gold price
- Indicated Mineral Resource of 27.4mt at 1.2 g/t Au (1.02 Moz), and
- Inferred Mineral Resource of 5.2mt at 1.2 g/t Au (0.20 Moz)
- Resource calculation sensitivity at a 0.5g/t Au cut-off and $1500 per ounce gold price
- Indicated Mineral Resource of 20.0mt at 1.5 g/t Au (923 Koz), and
- Inferred Mineral Resource of 3.8mt at 1.4 g/t Au (0.18 Moz)
- Preliminary pit shells at Mankouke South indicate a low strip-ratio resource that is mostly oxide, with a robust starter pit of between 5.3 million tonnes at 2.2 g/t (386,000 ounces at 0.75 g.t cut-off) and 4.5 million tonnes at 2.6 g/t (377,000 ounces at 1.0 g.t cut-off)
- Resource model sensitivities at various gold prices highlight low strip ratios from pit shells ranging from 2.4:1 to 2:7:1 (see Table 2)
- Mineral resource with 84% captured in the indicated category and minimal sensitivity to lower gold prices. (See Table 1)
- Further potential to improve resource estimates with LeachWELL assay process. Only 18% of current drilling has now been assayed by LeachWELL which thus far has shown substantial improvements with tested area’s lower-grades increasing between 10% and 40 %.
- Roscan plans to expand the use of LeachWELL on its existing resource base and to use it extensively for all future drilling.
- Further Exploration Upside
- Significant potential to increase the size of the MR with both the currently ongoing and future drilling programs.
- For additional details on the exploration upside not captured in this current resource update please see the 2nd press release issued by Roscan this morning titled: Roscan Outlines Potential Exploration Upside on Areas Within and Outside Current Resources.
- Identified mineralization under continued exploration include the follow up on the oxide and sulphide mineralization at Mankouke South, Kabaya and Kandiole KN1 resource areas, including their satellites and extensions.
Nana Sangmuah, President & CEO, stated, “This mineral resource suggests a stand-alone project status for the Kandiole Gold Project. The good metallurgical recoveries, high-grade starter pit, low strip ratios, and the high-quality resource with 84% included in the indicated resource category and 72% within saprolite, points to a potential high-margin LOM operation.
Importantly, this initial resource is just the beginning for the overall project potential, the mineral resource remains open to further growth with the pending results from our incremental drilling, which remains ongoing. In addition, there are 3 advanced targets and discoveries not yet captured to be included in subsequent updates, such as demonstrated by the drilling success at Walia, Disse and Kandiole North extension.
Management intends to commence in short order environmental studies to facilitate the permitting and further de-risking project development. We are encouraged by the ultimate scale potential at the Kandiole Project which we believe has significant upside and clearly positions Roscan amongst the few junior resource companies that can transition from early exploration to a significant mining operation.”
Resource Estimate Technical Details
The resource estimate for the Kandiole Gold Project, with effective date of March 31st, 2022, has been prepared by Mr. Ivor W.O. Jones, M.Sc., FAusIMM, CPgeo, P.Geo, who is an independent Qualified person (QP) under NI 43-101 guidelines. The Mineral Resource and Resource Estimate will be detailed in a technical report prepared in accordance with NI 43-101 to be filed on SEDAR within 45 days of this press release.
The Mineral Resources are derived from six deposit areas, including, in order of size, Mankouke South, Kabaya, Kandiole 1, Mankouke Central, Kandiole 2 4 and Moussala (see Figure 1 for locations). The input data for the Resource estimate comprises information from 1,789 drill-holes totaling 135,045 metres, including 38,357 metres of diamond drill holes (DDH and RCDD), 35,634 metres of reverse circulation holes (RC) and 61,054 metres of air core holes (AC).
A marginal cutoff grade (COG) of 0.30 g/t Au for all material has been applied for oxide mineralization, and 0.42 g/t for fresh and using a pit optimization based on a gold price of US$1500/oz. The MR is reported with only the blocks within a conceptual open pit shell, which uses the following assumptions:
- Gold Price: $1500 /oz
- Mining Cost: $1.75 /t for laterite and saprolite, $2.50 /t for saprock, $2.75 /t for fresh rock
- Mining Recovery: 95%
- Dilution: 5%
- Geotechnical slope angles: 35° for laterite and saprolite, 40° for saprock and fresh rock
The Mineral Resource classification resulted in Indicated Resources of 27.4Mt at 1.2g/t Au for 1,018koz, and Inferred resource of 5.2Mt at 1.2g/t Au for 199koz.
A detailed summary of the deposit by target areas is presented in the Table 1.
Table 1: Detailed summary of the deposit by target areas
| Mineral Resource (0.3/0.42 g/t Au cut-off) |
Sensitivity (0.5 g/t Au cut-off) |
||||||
|---|---|---|---|---|---|---|---|
| Mineral Resource Category |
Target Area | Tonnes (In Situ) |
Gold Grade |
Gold Content |
Tonnes (In Situ) |
Gold Grade |
Gold Content |
| mt | g/t | koz | mt | g/t | koz | ||
| Indicated | Mankouke South | 15.2 | 1.3 | 657 | 11.9 | 1.6 | 613 |
| Mankouke Central | 0.9 | 1.7 | 47.5 | 0.7 | 2.0 | 45.1 | |
| Kandiole | 2.8 | 0.9 | 79.7 | 1.8 | 1.2 | 67.2 | |
| Kabaya | 8.5 | 0.9 | 234 | 5.6 | 1.1 | 197 | |
| Total Indicated | 27.4 | 1.2 | 1,018 | 20.0 | 1.5 | 923 | |
| Inferred | Mankouke South | 2.8 | 1.4 | 124 | 2.2 | 1.6 | 116 |
| Mankouke Central | 0.1 | 0.8 | 1.4 | 0.0 | 1.2 | 1.0 | |
| Kandiole | 0.7 | 1.1 | 23.1 | 0.4 | 1.5 | 20.2 | |
| Kabaya | 1.2 | 0.8 | 32.7 | 0.8 | 1.0 | 28.0 | |
| Kandiole North 2 and 4 | 0.3 | 0.9 | 8.7 | 0.2 | 1.1 | 7.6 | |
| Moussala | 0.2 | 1.4 | 8.5 | 0.2 | 1.2 | 8.0 | |
| Total Inferred | 5.2 | 1.2 | 199 | 3.8 | 1.4 | 181 | |
- The effective date of the Mineral Resource Estimate is 31 March 2022.
- A marginal COG of 0.30 g/t Au for all material is applied for oxide mineralization, and 0.42 g/t for fresh.
- Mineral Resources, which are not Mineral Reserves, do not have demonstrated economic viability. The estimate of Mineral Resources may be materially affected by environmental, permitting, legal, marketing, or other relevant issues. The Mineral Resources in this Technical Report were estimated using CIM (2014) Standards on Mineral Resources and Reserves, Definitions and Guidelines.
- A test to determine whether or not there is a Reasonable Expectation of Economic Extraction of Mineral Resources was completed using a pit optimisation based on a gold price of US$1500/oz.
- The quantity and grade of reported the Inferred Resources in this estimation are uncertain in nature and there has been insufficient exploration to define this Inferred Resource as an Indicated or Measured Mineral Resource. It is uncertain if further exploration will result in upgrading the Inferred Resource to an Indicated or Measured Mineral Resource category.
- Contained metal and tonnes figures in totals may differ due to rounding.
The grade-tonnage model used as the resource model was prepared using ordinary kriging. Full details of the model will be available in the NI 43-101 technical report currently in preparation.
Sensitivity to Gold Price with Pit Optimisation
During the technical work to define the mineral resource, each of the resource models was tested to check for a Reasonable Expectation of Economic Extraction (REEE). As part of the REEE, the model was tested at various gold prices.
Table 2: Pit Optimization Results
| $1500 /oz | $1800 /oz | $1900 /oz | $2000 /oz | |
|---|---|---|---|---|
| Tonnes (mt) | 38.2 | 42.3 | 47.2 | 50.1 |
| Diluted Grade (g/t Au) | 1.04 | 0.94 | 0.92 | 0.89 |
| Metal (mOz) | 1.28 | 1.37 | 1.40 | 1.43 |
| Strip Ratio | 2.70:1 | 2.52:1 | 2.45:1 | 2.44:1 |
- These results are pit evaluation results and differ to the mineral resource.
- The cut-off grade varies according to the area being tested and is defined by the strip ratio and applied mining costs. The effective cut-off grade also varies by gold price and state of weathering.
- These results also include mineralisation as dilution which is below the cut-off grade for the mineral resource, but is above the marginal cut-off grade
Exploration Target – Potential Resource Growth
The exploration target was defined from the grade-tonnage model used to define the mineral resource. This model included estimates with low confidence that did not meet the company’s criteria for defining the mineral resource and from outside the reported MR’s pit shells. These additional tonnages and Au grades have been reported using a cut-off grade of 0.3 g/t Au for the Upper Tonnage Range of the estimates and 0.5 g/t for the Lower Tonnage Range estimates. The 0.3 g/t report includes lower confidence estimates than those for the 0.5 g/t cut-off. The interim results are reported below:
Table 3: Exploration Target
| Exploration Areas (*) Total | Tonnes (mt) | Au (g/t) |
|---|---|---|
| Lower range (*) | 8.0 | 1.0 |
| Upper Range (**) | 30.0 | 0.8 |
(*) Upper range from 0.3/0.42 cut-off includes lowest confidence estimates
(**) Lower range from 0.5/0.5 cut-off
Note: the aforementioned “Exploration Target” is reported as a range of quantities and grades. They are conceptual in nature and there has not been sufficient exploration to define a mineral resource. It is uncertain if future exploration will result in the target being delineated as a mineral resource.
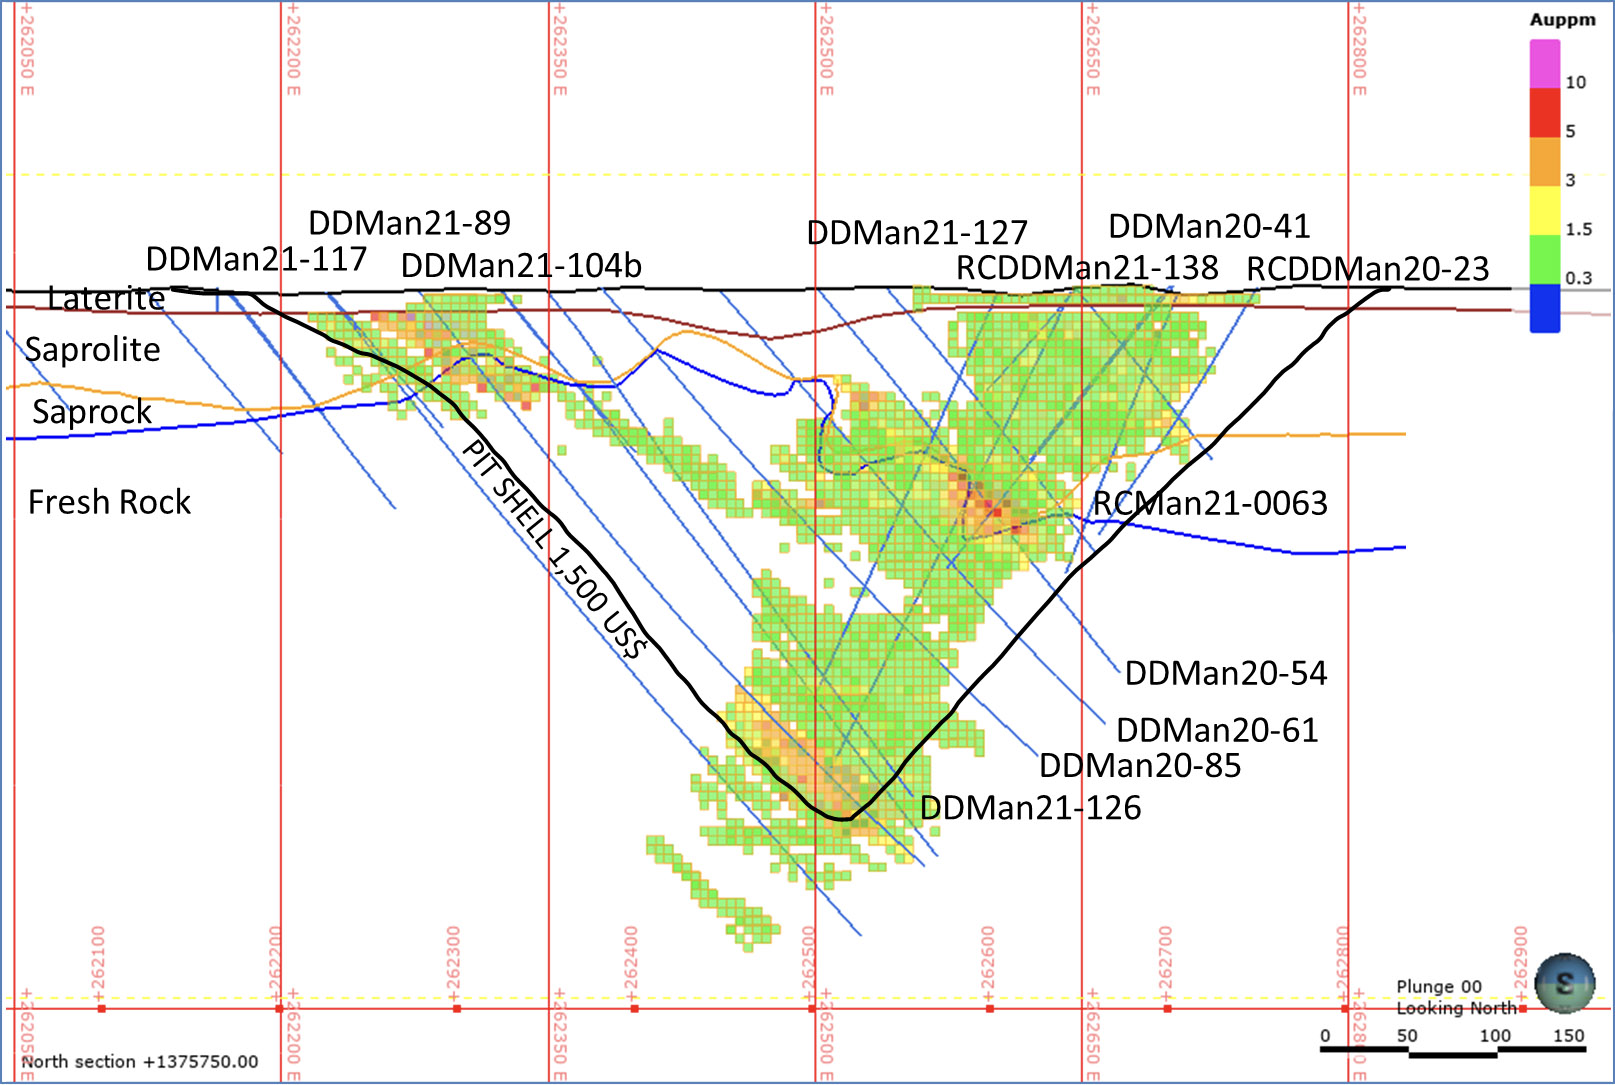
Figure 1: Mankouke South Section 1375750 with block model 5m x 5mx 5m
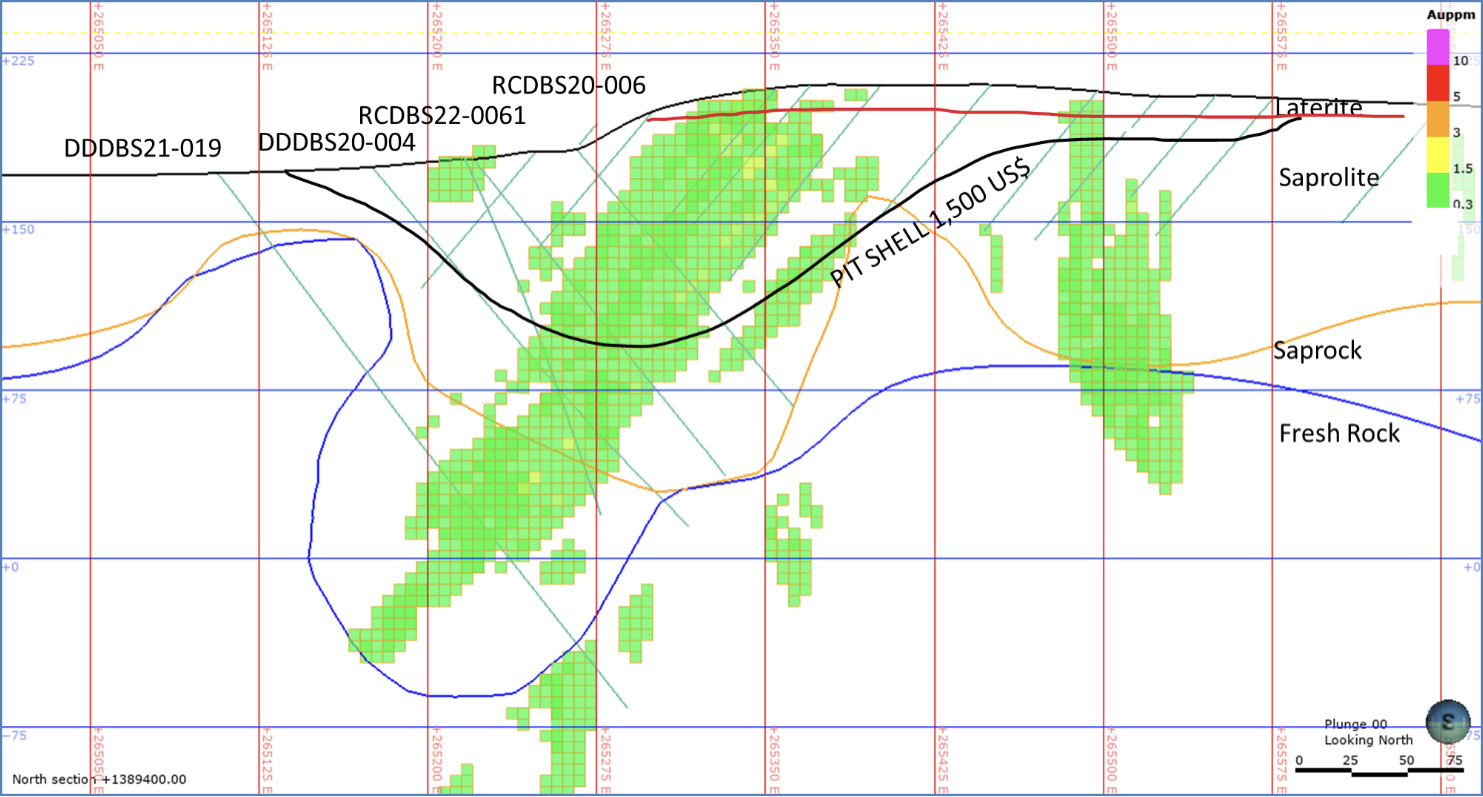
Figure 2: Kabaya Section 13789400 with block model 5m x 5mx 5m.

Figure 3: Kandiole 1 Section 1386595 with block model 5m x 5mx 5m.
Qualified Person
Mr. Ivor Jones, (BSc. Hons), MSc, FAusIMM, P.Geo., of Aurum Consulting is an independent Qualified Person as defined under National Instrument 43-101 - Standards of Disclosure for Mineral Projects (“NI 43-101”). Mr. Jones has reviewed and approved the contents of this press release.
About Roscan
Roscan Gold Corporation is a Canadian gold exploration company focused on the exploration and acquisition of gold properties in West Africa. The Company has assembled a significant land position of 100%-owned permits in an area of producing gold mines (including B2 Gold’s Fekola Mine which lies in a contiguous property to the west of Kandiole), and major gold deposits, located both north and south of its Kandiole Project in West Mali.
For further information, please contact:
Nana Sangmuah
President & CEO
Tel: (902) 832-5555
Email: info@Roscan.ca
Forward Looking Statements
This news release contains forward-looking information which is not comprised of historical facts. Forward-looking information is characterized by words such as “plan”, “expect”, “project”, “intend”, “believe”, “anticipate”, “estimate” and other similar words, or statements that certain events or conditions “may” or “will” occur. Forward-looking information involves risks, uncertainties and other factors that could cause actual events, results, and opportunities to differ materially from those expressed or implied by such forward-looking information. Factors that could cause actual results to differ materially from such forward-looking information include, but are not limited to, changes in the state of equity and debt markets, fluctuations in commodity prices, delays in obtaining required regulatory or governmental approvals, and other risks involved in the mineral exploration and development industry, including those risks set out in the Company’s management’s discussion and analysis as filed under the Company’s profile at www.sedar.com. Forward-looking information in this news release is based on the opinions and assumptions of management considered reasonable as of the date hereof, including that all necessary governmental and regulatory approvals will be received as and when expected. Although the Company believes that the assumptions and factors used in preparing the forward-looking information in this news release are reasonable, undue reliance should not be placed on such information. The Company disclaims any intention or obligation to update or revise any forward-looking information, other than as required by applicable securities laws.
Neither the TSX Venture Exchange nor its Regulation Services Provider (as that term is defined in the policies of the TSX Venture Exchange) accepts responsibility for the adequacy or accuracy of this release